B2B SaaS Analytics

Composable Revenue & Retention Intelligence for Growing Businesses

Developing a composable revenue intelligence architecture with a scalable design system to support advanced cohort analysis and business growth.

CohortGenie delivers subscription and revenue intelligence for modern businesses by integrating directly with QuickBooks. The platform converts complex accounting data into structured cohort analytics, retention insights, and financial performance dashboards built for scalability and actionable decision-making.

Services:

Tech Stack

Retention Insight Accuracy
+ 0 %
Revenue Trend Visibility
+ 0 %
Churn Detection Speed
0 x Faster
Decision Making
0 x Faster

Project Description

Many SaaS companies struggle to clearly understand how their customer revenue, retention, and churn evolve over time. While accounting platforms like QuickBooks store financial data, turning that data into meaningful insights often requires complex spreadsheets and manual analysis.


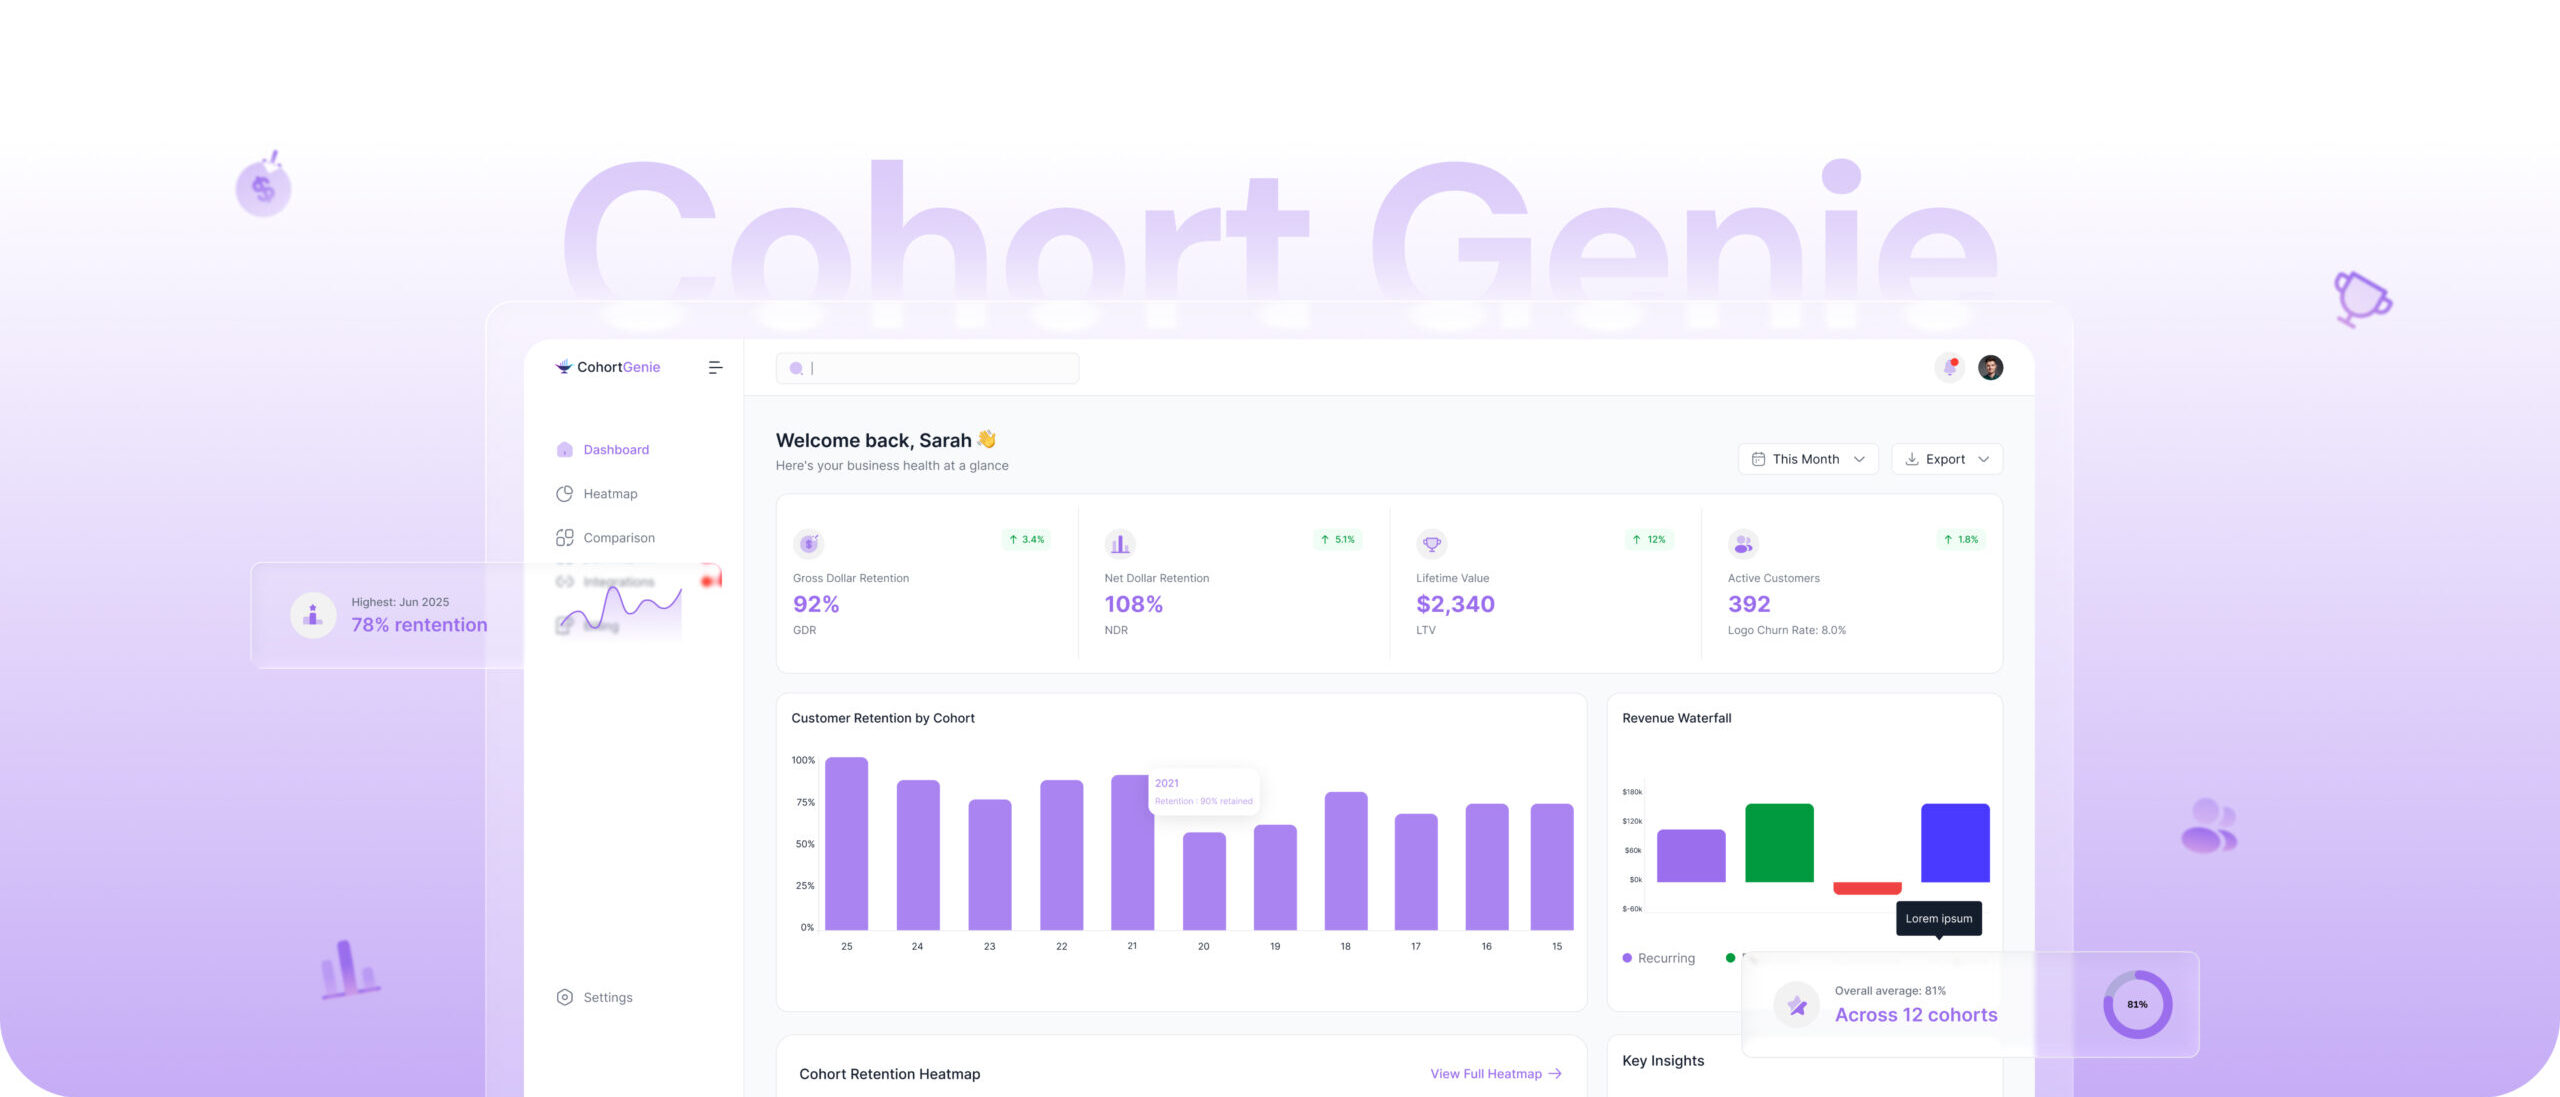
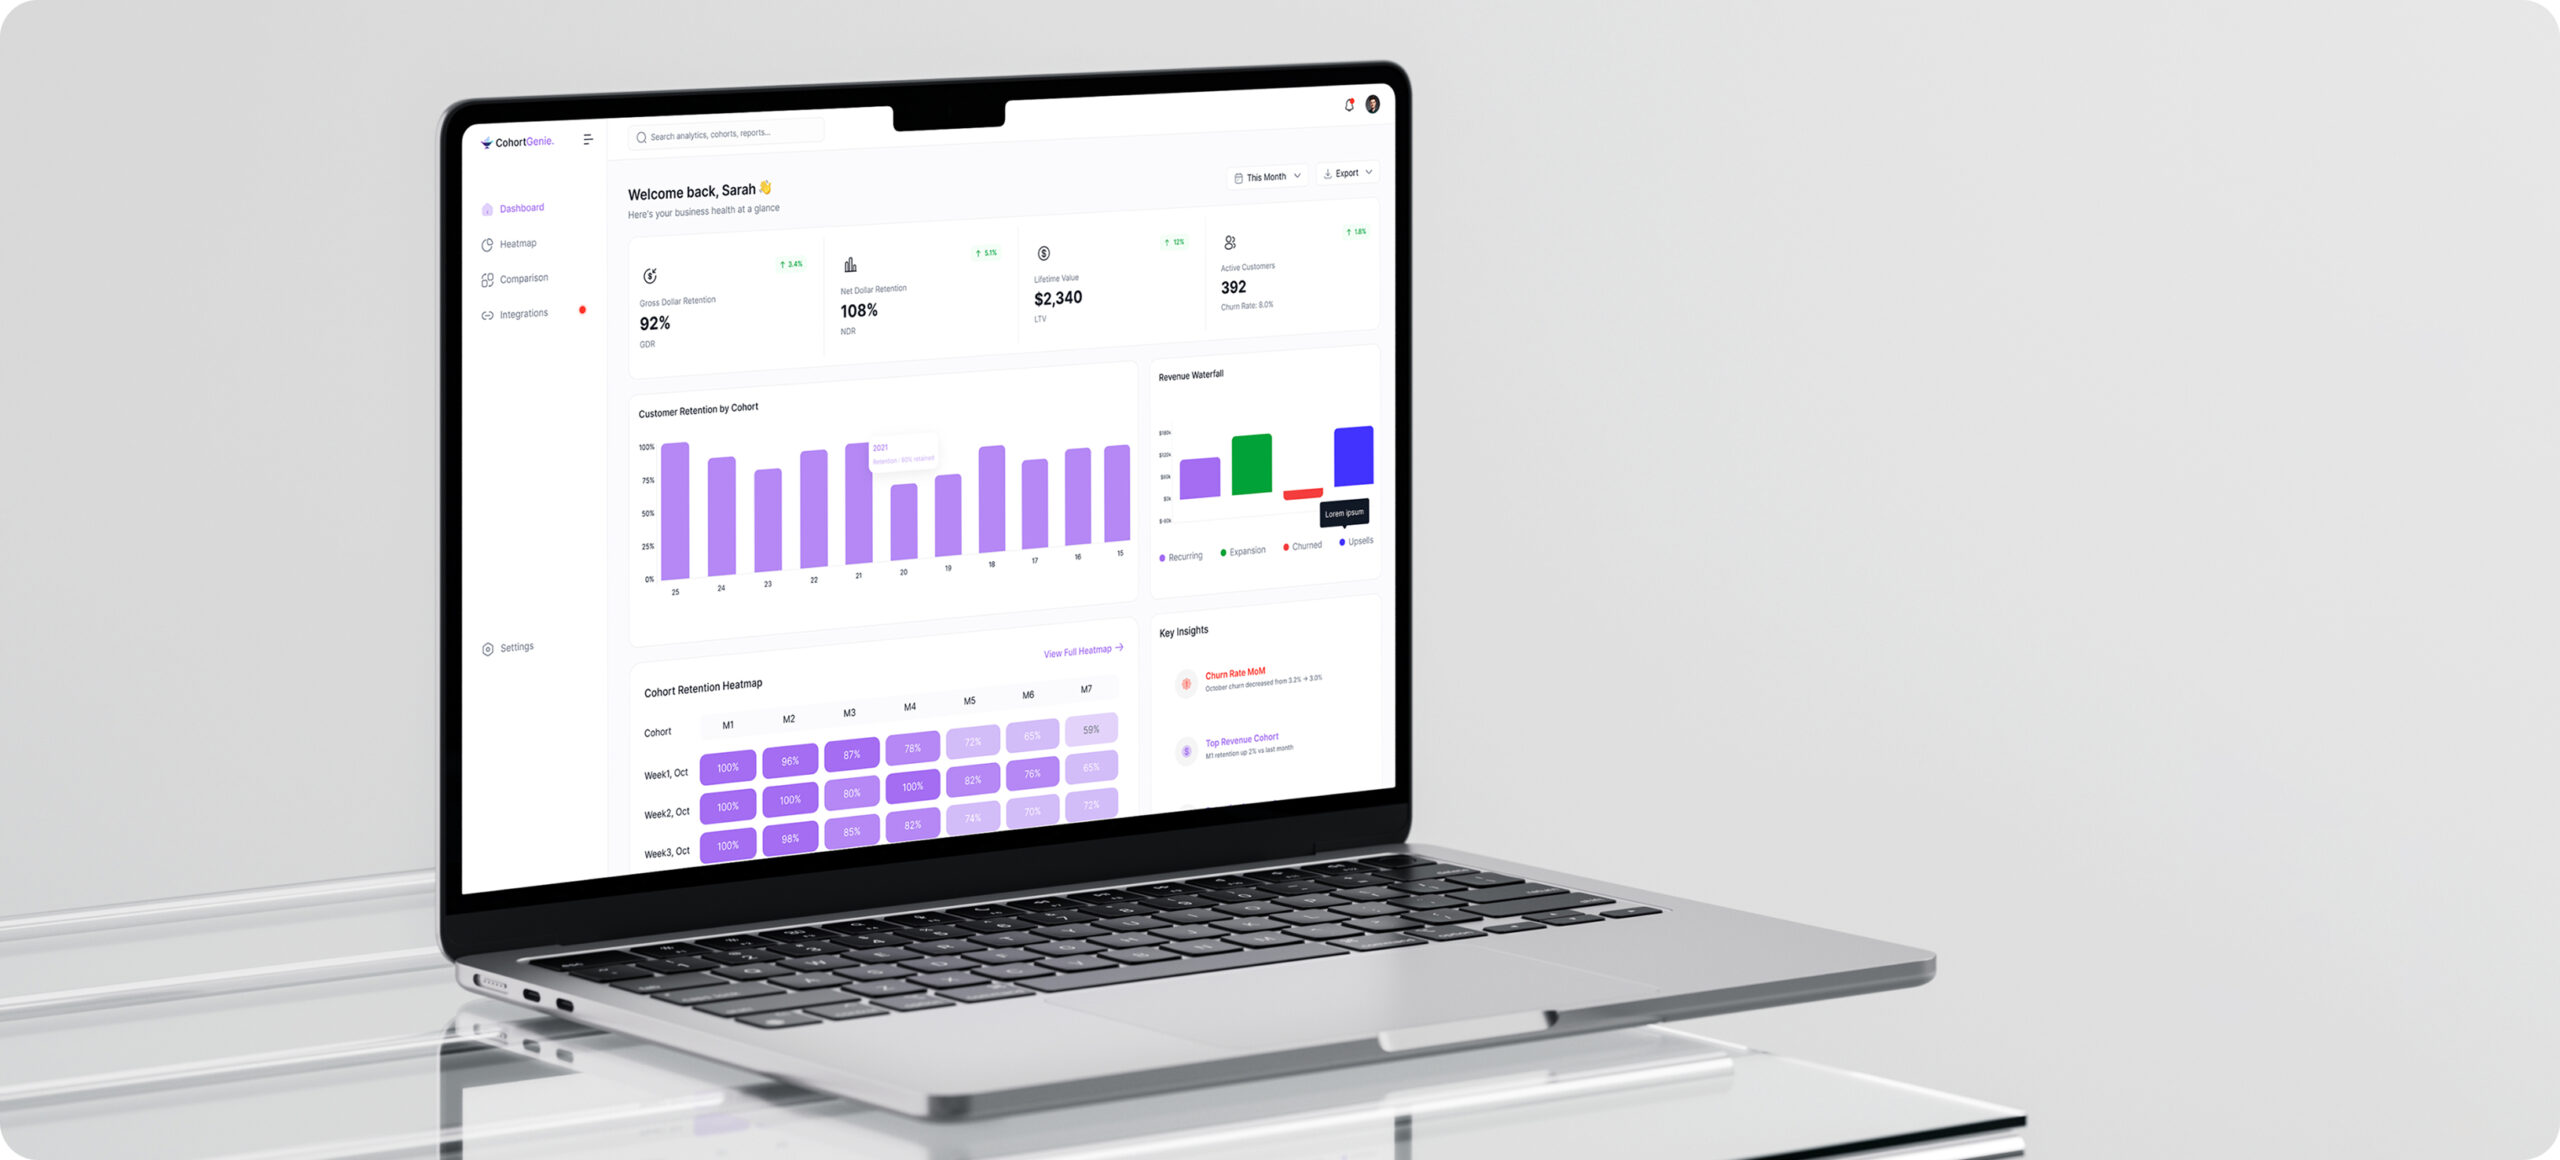
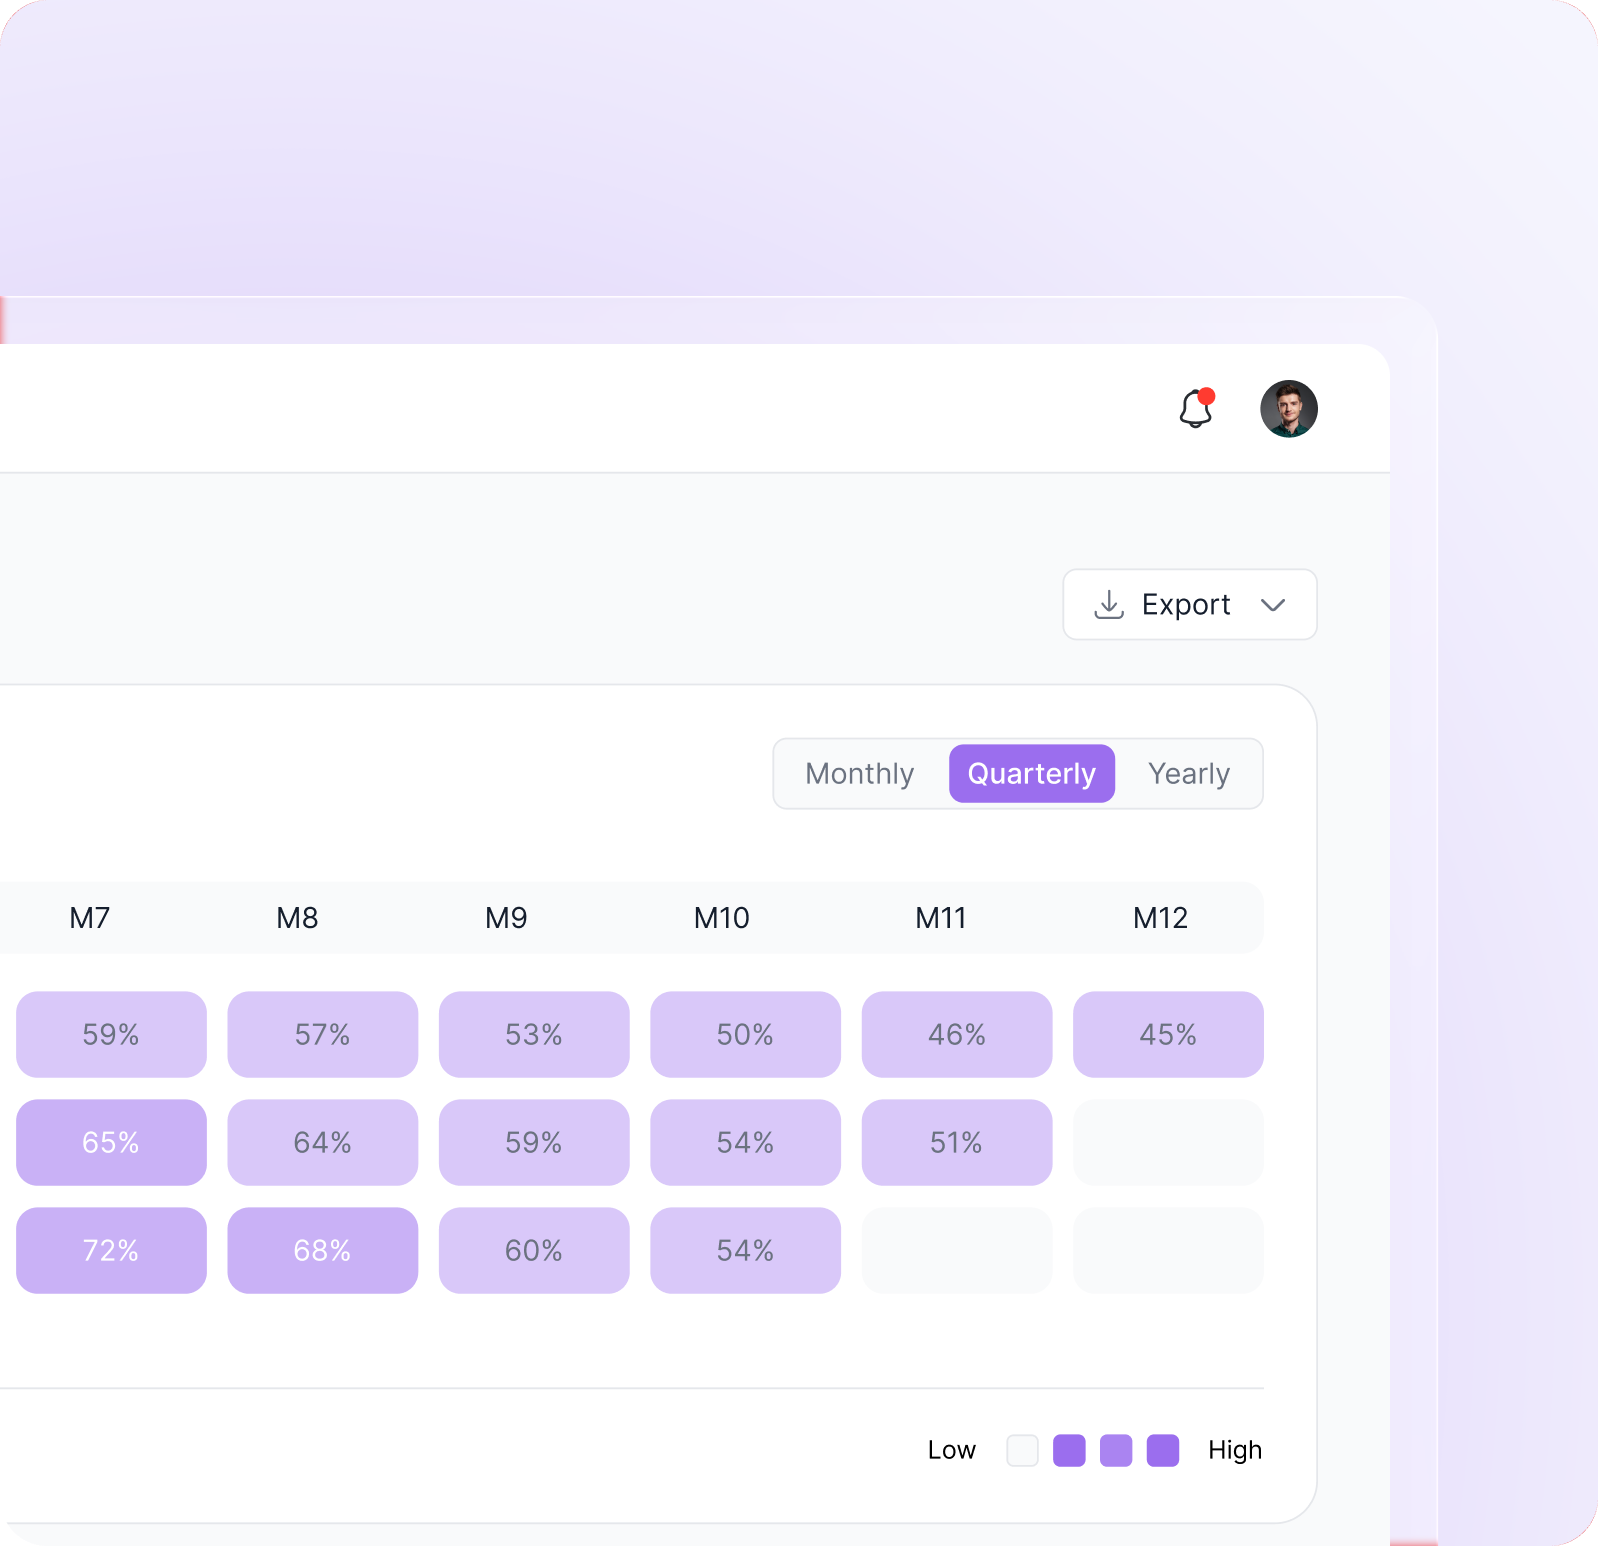
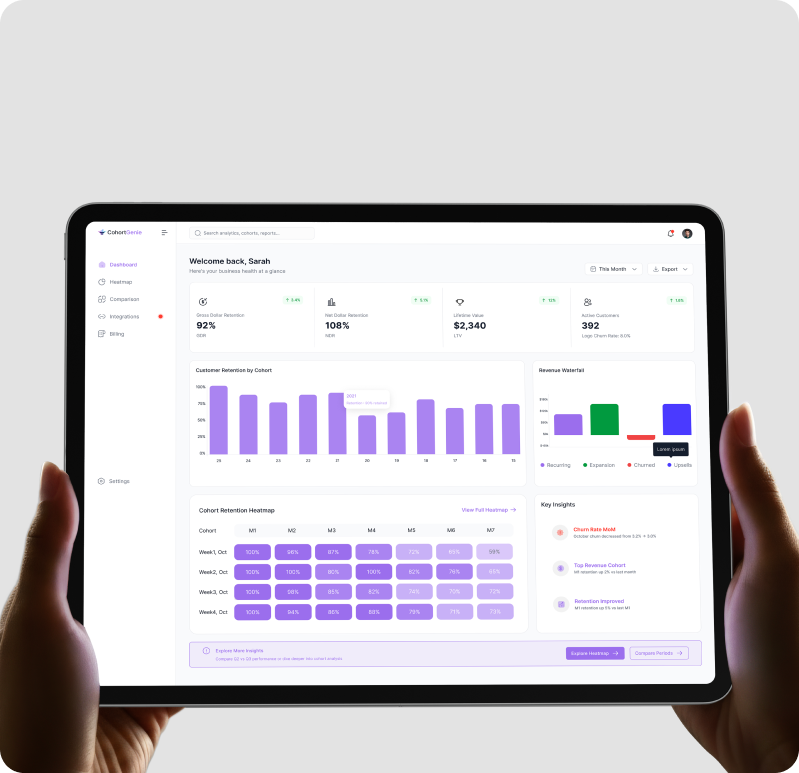
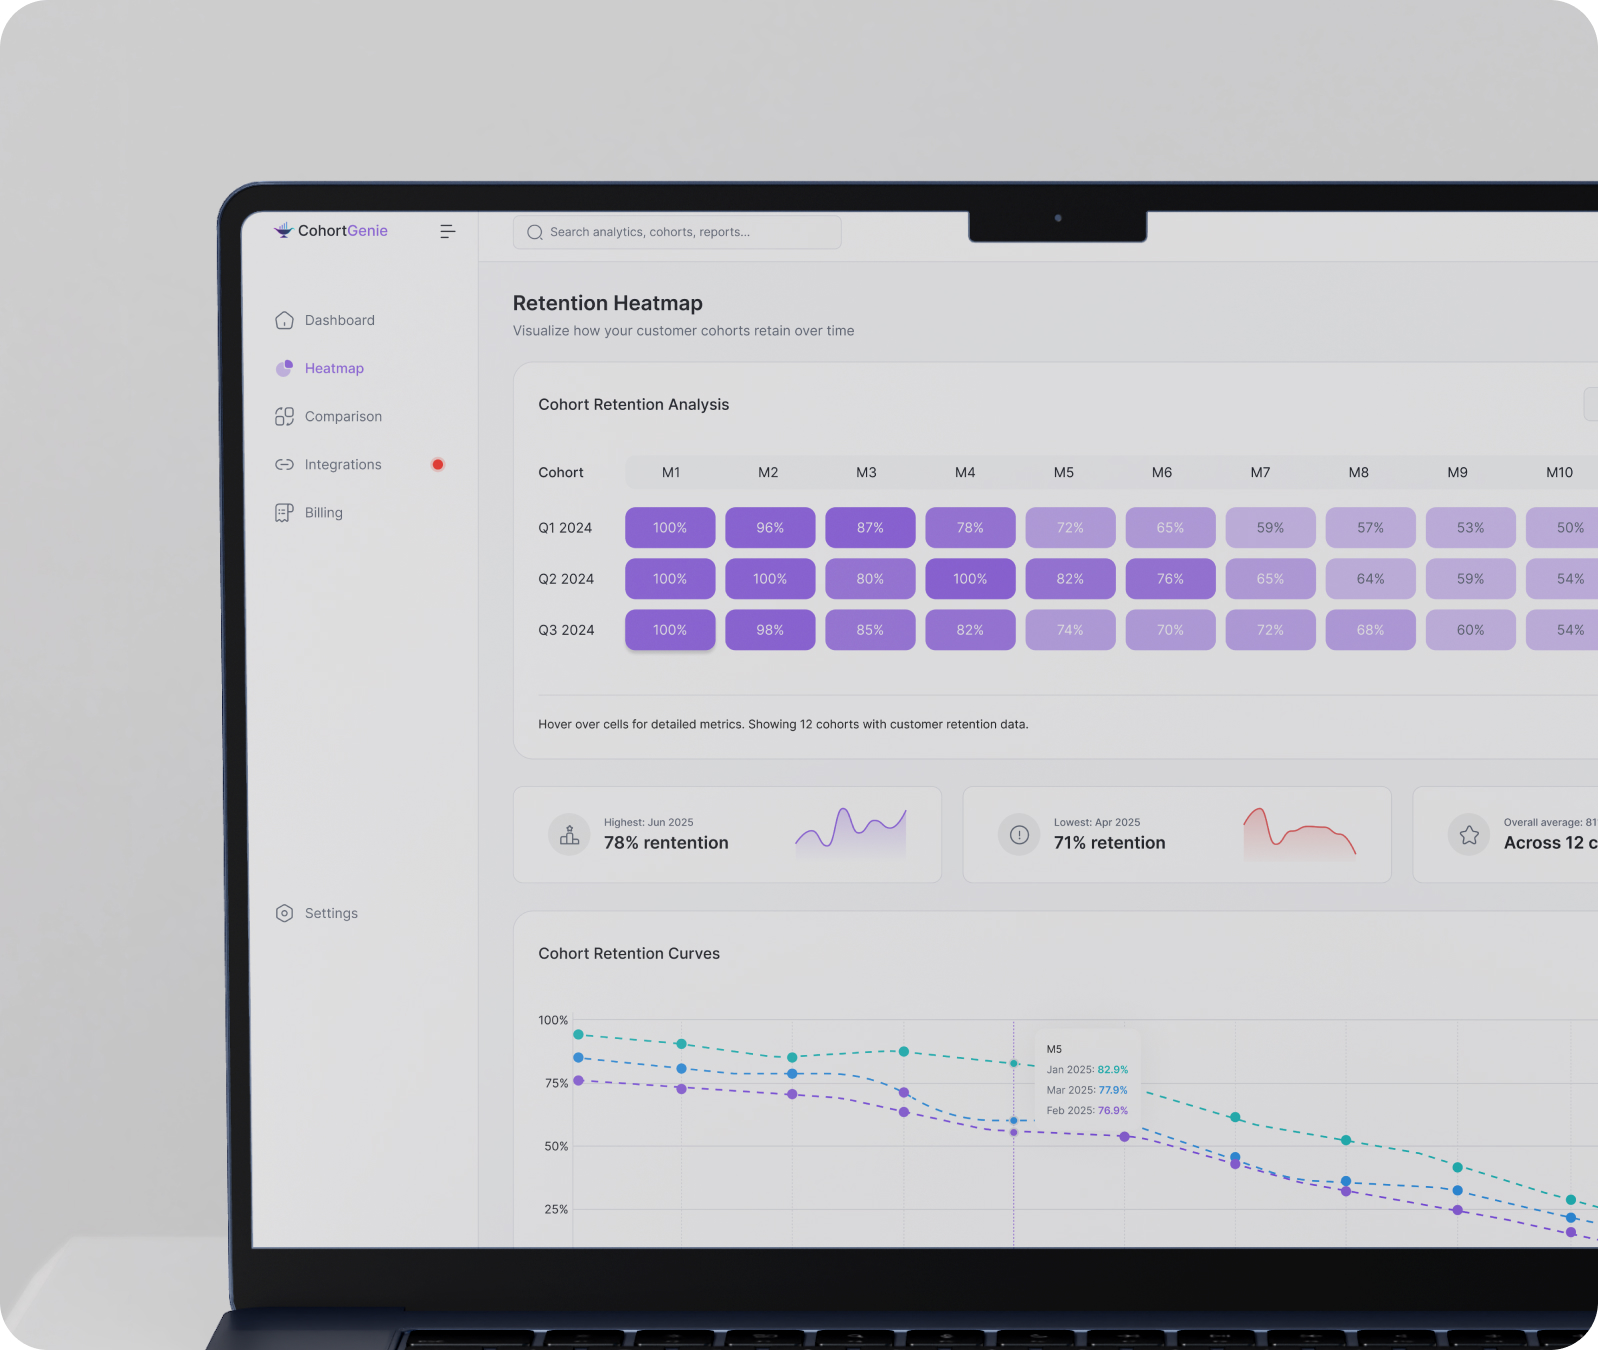
This project focused on designing a Cohort Analytics dashboard that integrates with QuickBooks to transform financial data into clear, visual insights. The goal was to help businesses track customer cohorts, retention trends, churn rates, and revenue performance in a simple and intuitive way.

Through a clean and structured dashboard experience, the platform enables teams to quickly understand how different customer groups behave over time and make smarter, data-driven decisions. The design prioritizes clarity, simplicity, and actionable insights, allowing users to move from raw financial data to meaningful business understanding with minimal friction.

Problem

This case study explores the challenges businesses face when trying to understand customer behavior and revenue trends using financial data. While platforms like QuickBooks store valuable information, turning that data into meaningful insights is often difficult. Several key challenges highlighted the need for a clearer, more intuitive analytics solution.

Financial data in tools like QuickBooks is often presented in complex reports, making it difficult for teams to understand customer retention, churn, and revenue patterns.

Businesses struggle to analyze cohort performance over time because important metrics are buried in spreadsheets or scattered across multiple reports.

The lack of clear visualizations forces teams to manually analyze data, slowing down decision-making and limiting their ability to identify growth opportunities.

Solution

This case study explores the challenges businesses face when trying to understand customer behavior and revenue trends using financial data. While platforms like QuickBooks store valuable information, turning that data into meaningful insights is often difficult. Several key challenges highlighted the need for a clearer, more intuitive analytics solution.

Automatic QuickBooks integration imports financial and customer data, eliminating manual data handling and simplifying analysis.

Cohort analysis and retention tracking allow businesses to monitor how different customer groups behave over time and identify churn patterns.

Visual dashboards and heatmaps present complex financial metrics in a clear format, enabling faster insights and more confident decision-making.

Key Features

The platform connects directly with QuickBooks to automatically import financial and customer data, eliminating the need for manual data entry and spreadsheets.

Customers are grouped into cohorts based on their start date, allowing businesses to track how different groups behave over time and analyze retention patterns.

Users can monitor both logo churn (customers lost) and dollar churn (revenue lost), helping teams understand where and why customer drop-offs occur.

Interactive charts and dashboards show how revenue evolves across different cohorts, making it easier to identify growth opportunities and financial risks.

A visual heatmap highlights retention performance across different time periods, enabling users to quickly spot trends and patterns in customer engagement.

Users can compare multiple cohorts side-by-side to understand how changes in strategy, pricing, or acquisition channels impact customer retention.

A centralized dashboard presents key metrics such as retention rates, churn, revenue growth, and cohort performance in a clear and actionable format.

The platform includes billing features with Stripe integration, allowing users to manage subscriptions, view invoices, and upgrade plans easily.

The Result

After the redesign, ESDIAC delivered a clear and measurable impact across usability and engagement. Users completed key tasks 40% faster, showing a stronger flow and better navigation. “Download App” clicks increased by 25%, while understanding of core services improved by 30%. It’s proving that the new experience built clarity, confidence, and real business value for global users across different regions and use cases.

Stories of Trust, Vision and Growth.

Case Studies.

Hey Ya’ll!
What Are We Shaping Today?

    Area of Interest


    10K

    Loop Background

    Loop begins with curiosity.

    Vision shapes every detail.

    Evolution completes the journey.