Fintech
Smart Trading Intelligence for Data-Driven Traders
Creating a scalable trading intelligence system for advanced analytics and data-driven decision-making.
Fyntrix empowers traders with performance and analytics intelligence, converting complex trading activity into scalable dashboards and actionable insights.
Services:
Tech Stack
Project Description
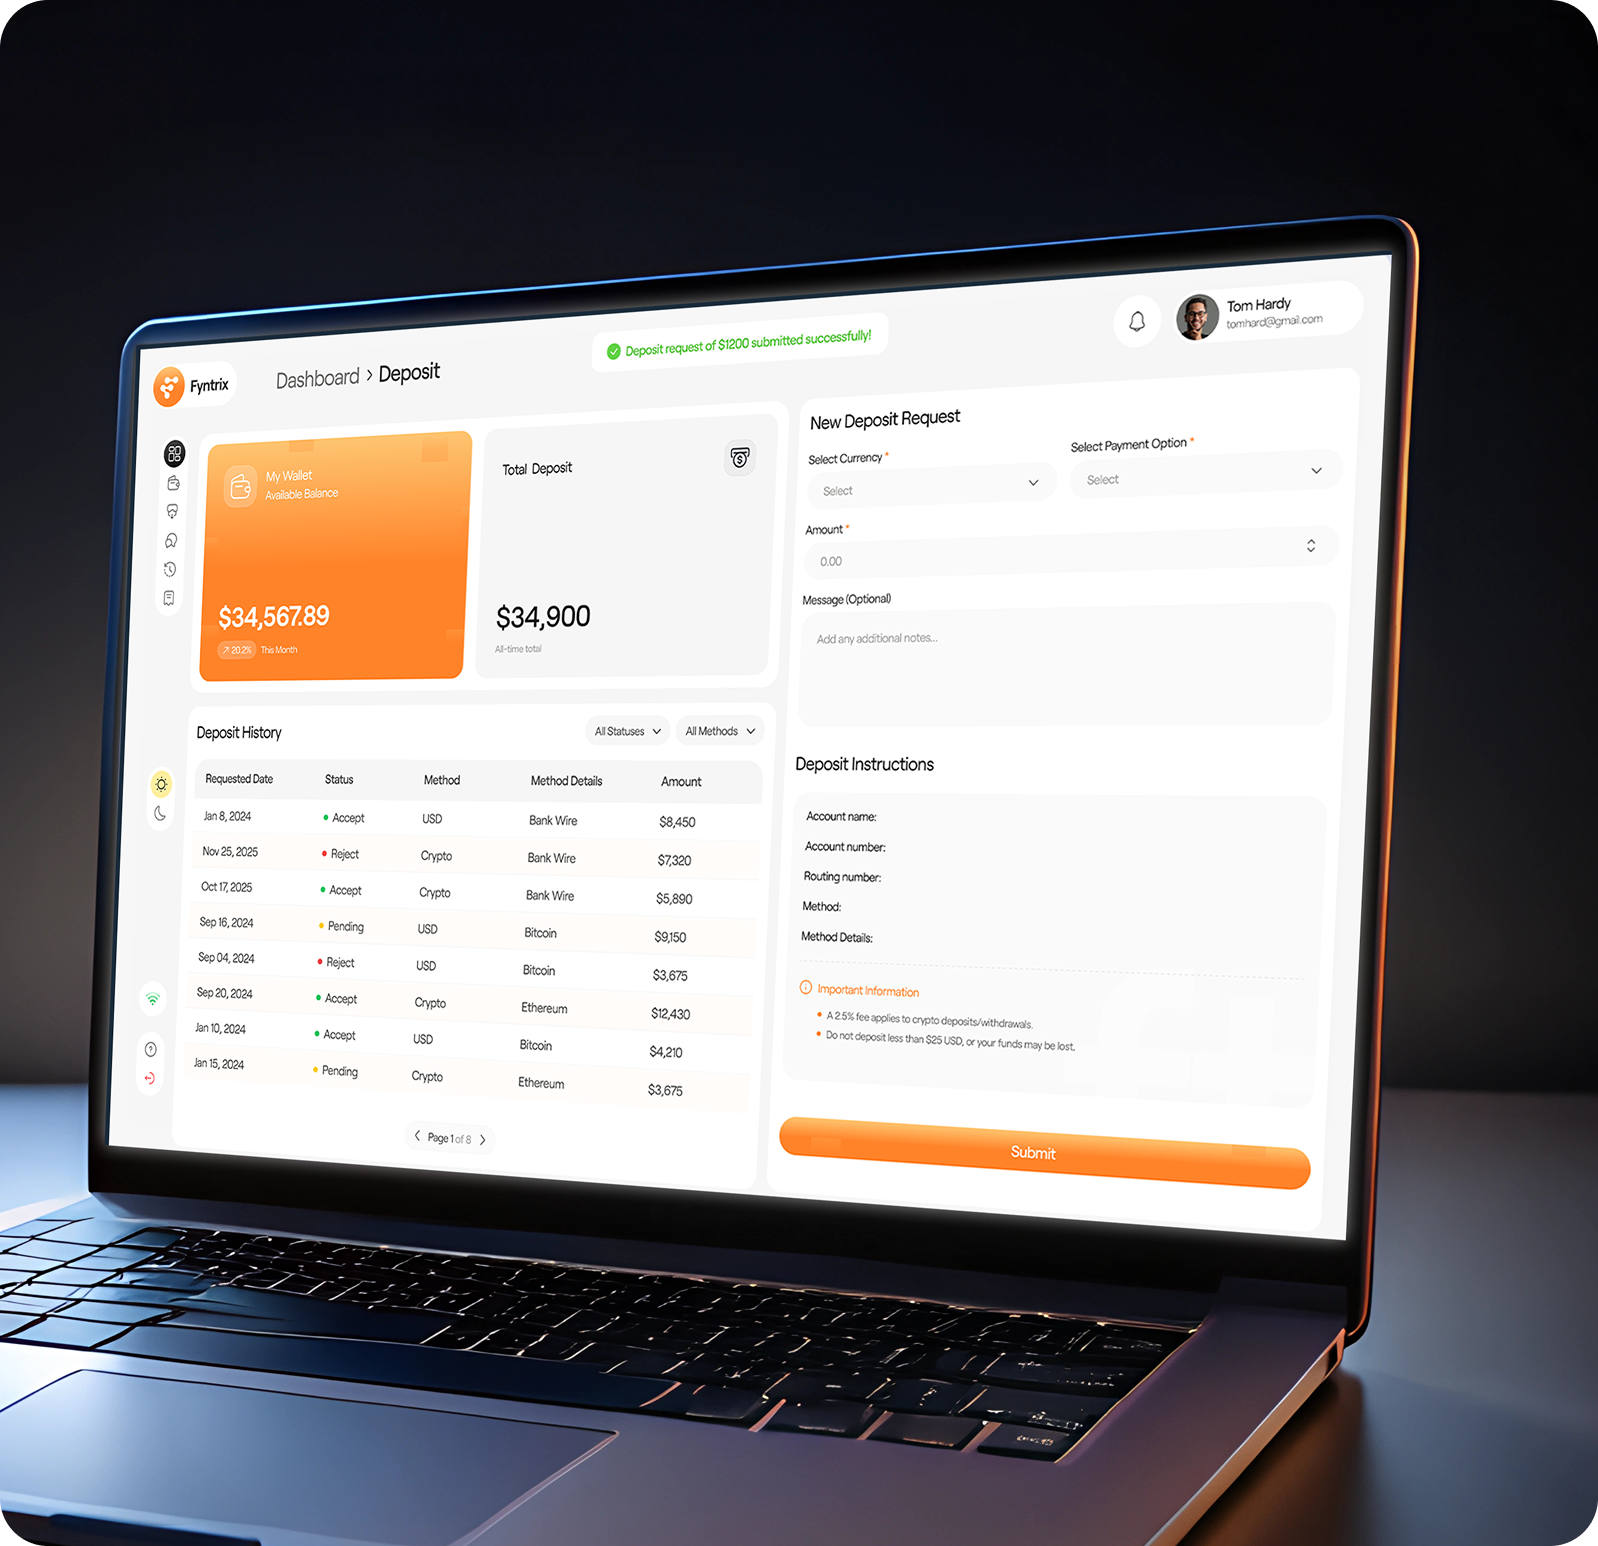
Many traders struggle to clearly understand how their performance, win/loss rates, and trading patterns evolve over time. While trading platforms store raw data, turning that data into actionable insights often requires manual tracking and complex spreadsheets.
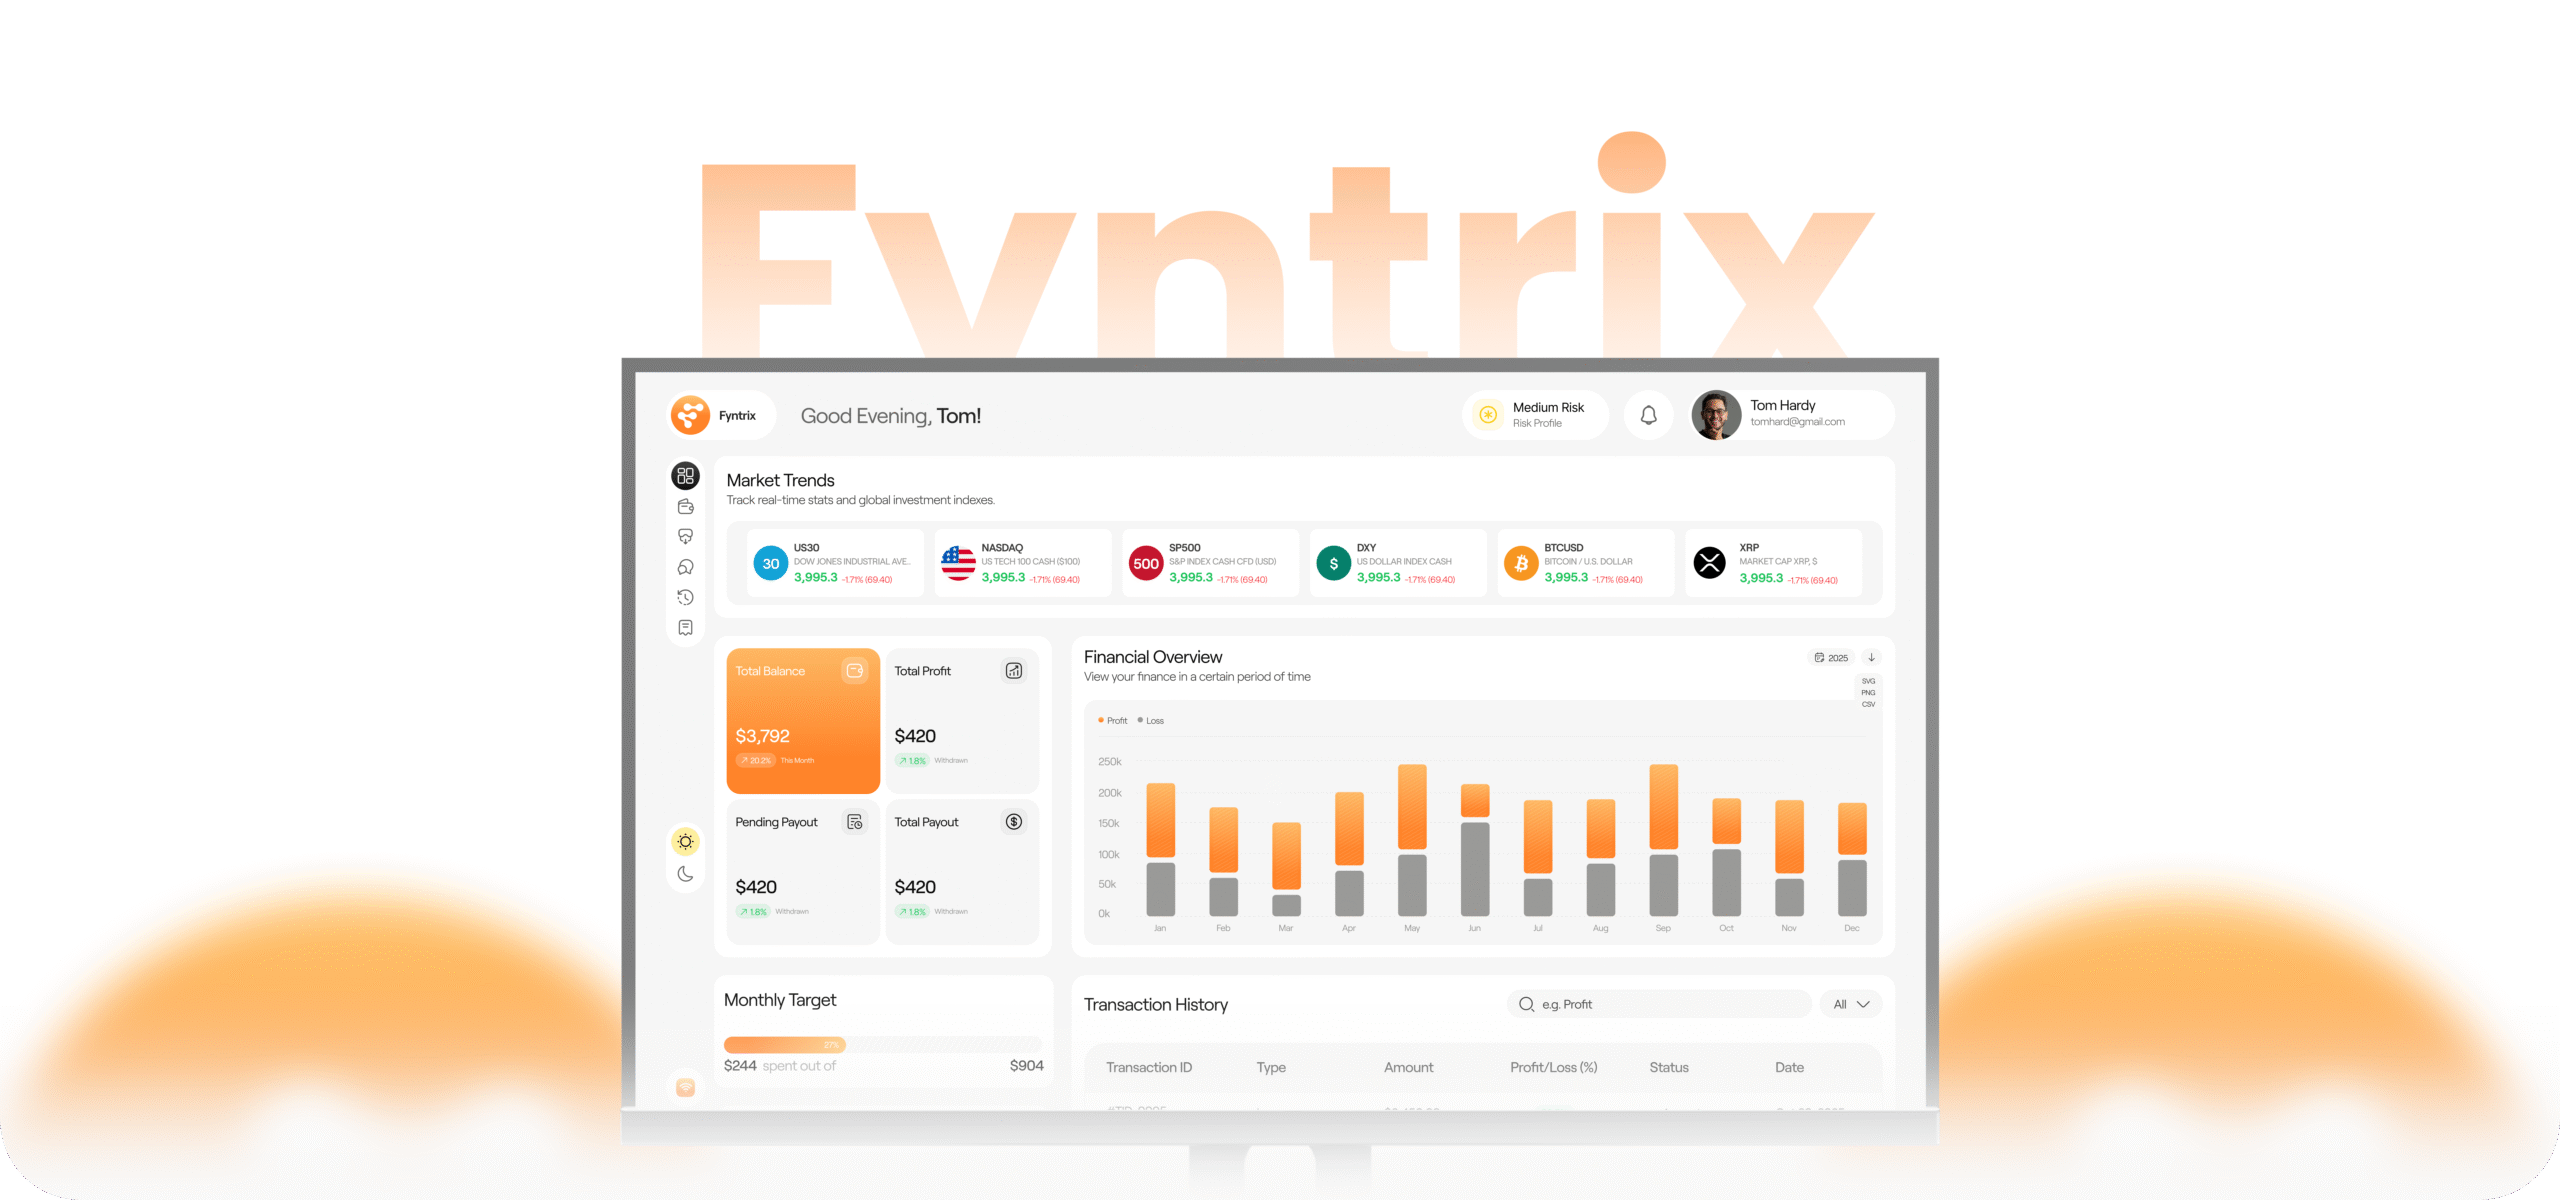
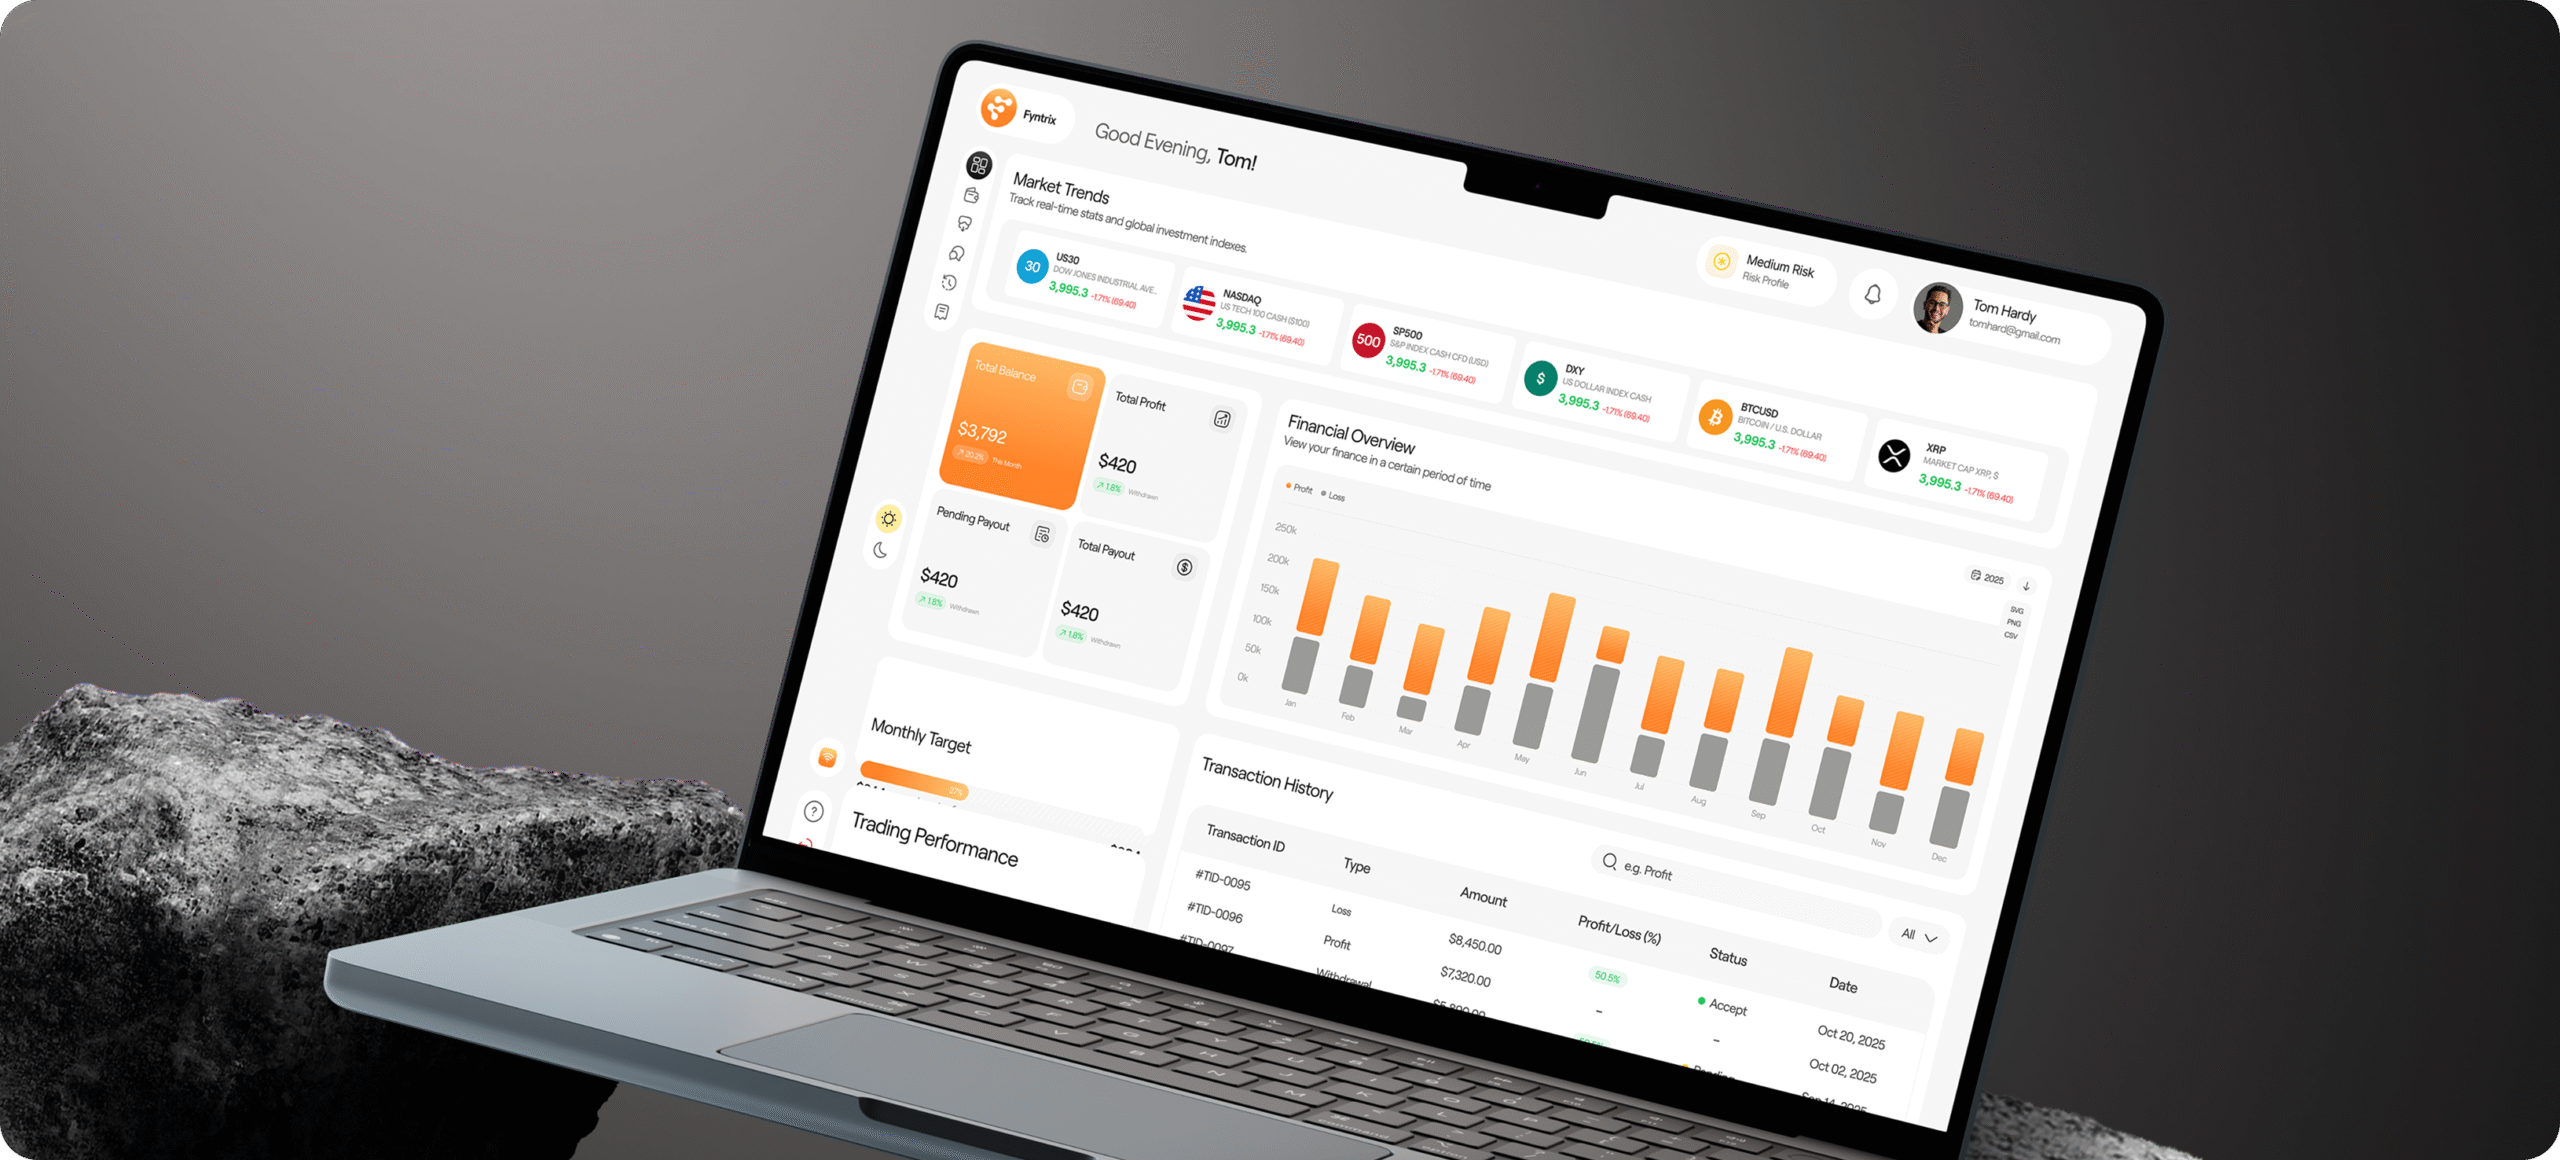
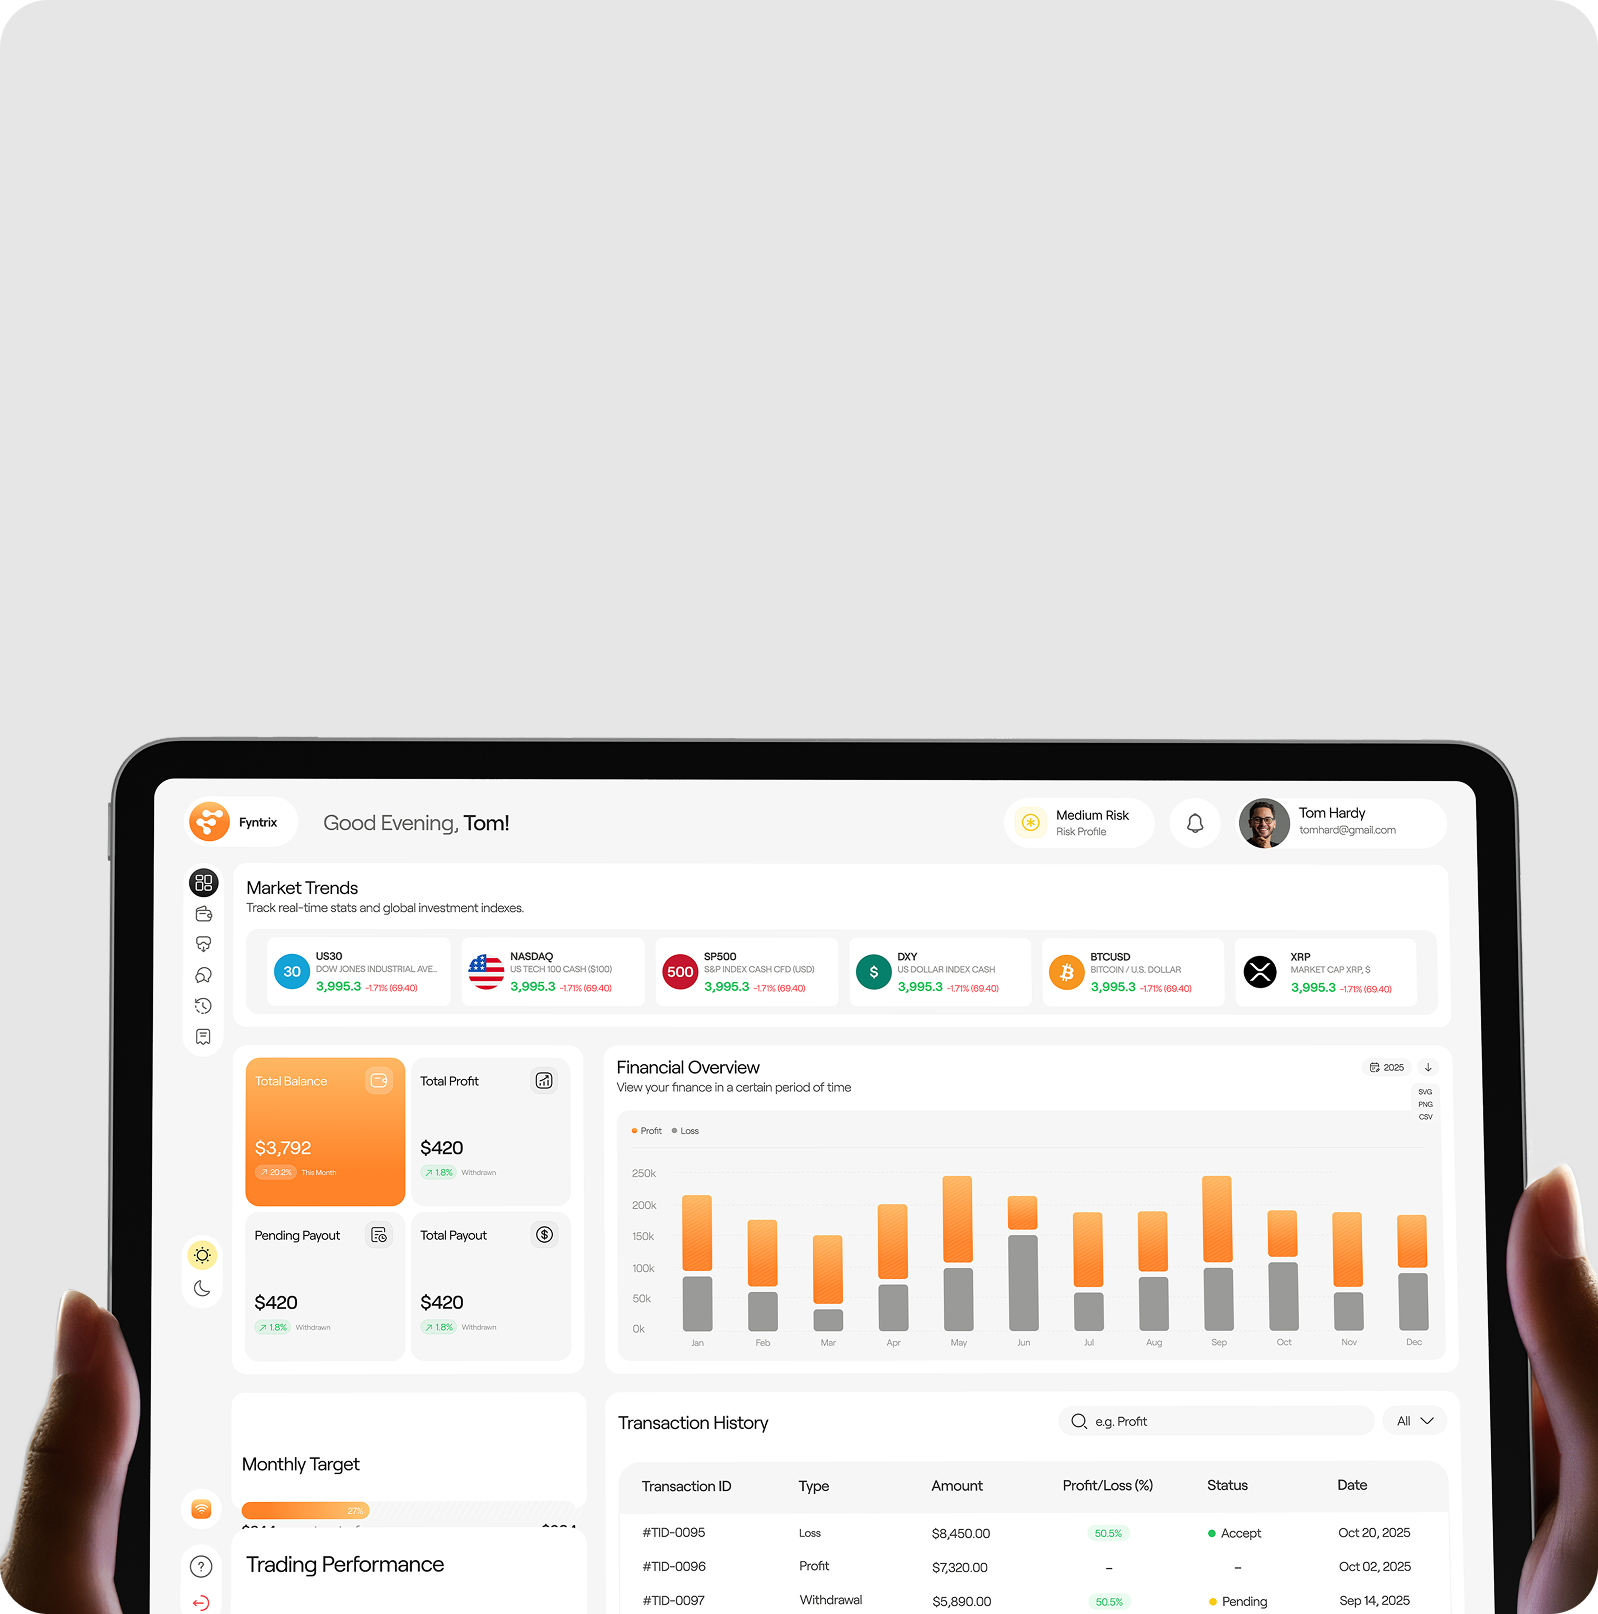
This project focused on designing a Trading Performance Analytics dashboard that integrates real-time trading data to transform complex activity into clear, visual insights. The goal was to help traders monitor performance trends, detect patterns, analyze strategies, and make smarter trading decisions in a simple and intuitive way.
Through a clean and structured dashboard experience, the platform enables traders to quickly understand how their trades and performance patterns evolve over time and make smarter, data-driven decisions. The design prioritizes clarity, simplicity, and actionable insights, allowing users to move from raw trading data to meaningful performance understanding with minimal friction.
Problem
This case study explores the challenges traders face when trying to understand their performance, win/loss trends, and trading patterns using raw trading data. While trading platforms store valuable information, turning that data into actionable insights is often difficult. Several key challenges highlighted the need for a clearer, more intuitive analytics solution.
- Problem 1
Raw trading data is often presented in complex logs or spreadsheets, making it difficult for traders to quickly understand performance trends, win/loss ratios, and strategy effectiveness.
- Problem 2
Traders struggle to analyze patterns and performance over time because key metrics are scattered across multiple reports or platforms, limiting their ability to spot profitable strategies.
- Problem 3
The lack of clear visualizations forces traders to manually track performance, slowing down decision-making and reducing the ability to optimize trades or detect high-risk patterns.
Solution
To address these challenges, we designed a trading performance analytics platform that transforms raw trading data into clear, actionable insights. By integrating real-time trading activity and presenting data through intuitive dashboards, the platform helps traders better understand performance trends, win/loss patterns, and optimize their trading strategies.
- Solution 1
Fyntrix consolidates complex trading data into intuitive dashboards, allowing traders to quickly understand win/loss trends, performance metrics, and strategy effectiveness at a glance.
- Solution 2
The platform provides advanced pattern and trend analysis over time, helping traders track performance across sessions, spot recurring patterns, and identify profitable strategies without juggling multiple reports.
- Solution 3
Clear visualizations and interactive analytics tools reduce manual tracking, accelerate decision-making, and empower traders to optimize their strategies, detect high-risk trades, and improve overall performance.
Key Features
- Real-Time Performance Dashboard
Fyntrix consolidates all trading activity into a single, intuitive dashboard, allowing traders to instantly see their win/loss ratios, session summaries, and overall performance trends.
- Advanced Pattern & Trend Analysis
The platform tracks performance over time, identifies recurring trading patterns, and highlights high- and low-performing strategies to help traders optimize their approach.
- Actionable Insights & Alerts
Traders receive data-driven recommendations, alerts on high-risk trades, and highlights of profitable opportunities, enabling faster and smarter decision-making.
- Customizable Metrics & Analytics
Fyntrix allows users to monitor key trading metrics such as win rate, payout trends, and trade frequency, with flexible filters for sessions, instruments, and timeframes.
- Interactive Visualizations
Graphs, charts, and heatmaps present complex trading data in a simple, visual format, making it easier to evaluate trends, compare sessions, and spot patterns at a glance.
- Scalable Design System
The modular dashboard components are designed to grow with the platform, supporting larger data volumes and additional features without compromising clarity or usability.
- Seamless Data Integration
Fyntrix pulls trading data directly from connected platforms and brokers, ensuring up-to-date, accurate information without the need for manual tracking.
The Result
The Fyntrix trading analytics platform delivered significant improvements for traders by transforming raw trading data into clear, actionable insights. Users experienced a 35% increase in accuracy when tracking trade performance, alongside 42% better visibility into win/loss patterns and trading trends. The platform enabled 2.5x faster detection of recurring patterns and high-risk trades, allowing traders to respond quickly to changing market conditions. Overall, decision-making became 3x faster, empowering traders to optimize strategies, manage risk more effectively, and achieve more consistent performance across their trading activity.
Stories of Trust, Vision and Growth.
Willi O.
Howard T.
Andrew N.
Tracy D.
Marcus L.
Case Studies.
Hey
Ya’ll!
What Are We Shaping Today?